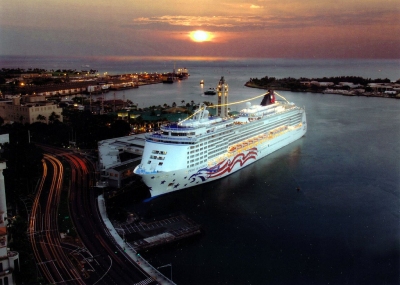
![NCL Cruise from NYC to Bermuda (Curtis & Renee) [flickr.com] CC BY-SA
License Information available under 'Proof of Image Sources'](/wp-content/uploads/reiseziele/ncl-cruise-from-nyc-to-bermuda77712.jpg "NCL Cruise from NYC to Bermuda (Curtis & Renee) [flickr.com] CC BY-SA
License Information available under 'Proof of Image Sources'")
Furthermore, we analyzed all climate data and provide a recommendation about which months are best to visit Northern America Cruises for your holiday.
Climate Overview
 -15 °C to 29 °C
 1 °C to 23 °C
 2.44 – 4.21 in (6 – 17 Days of Rain)
Average Annual Temperature is between 6.2 °C (Montreal) and 12.4 °C (New York)
Show temperatures in degree
Best Time to Visit Northern America Cruises: Overview
JanuaryJan MaximumMax. 3 °C Water max. 3 °C | FebruaryFeb MaximumMax. 4 °C Water max. 2 °C | MarchMar MaximumMax. 9 °C Water max. 4 °C | AprilApr TemperaturesTemp. up to 15 °C Water max. 8 °C | MayMay Best time to traveltime PerfectPerf. climate in Montreal New York Boston | JuneJun Best time to traveltime PerfectPerf. climate in Montreal New York Boston |
JulyJul Best time to traveltime PerfectPerf. climate in Montreal New York Boston | AugustAug Best time to traveltime PerfectPerf. climate in Montreal New York Boston | SeptemberSep Best time to traveltime PerfectPerf. climate in Montreal New York Boston | OctoberOct TemperaturesTemp. up to 18 °C | NovemberNov MaximumMax. 12 °C Water max. 11 °C | DecemberDec MaximumMax. 6 °C Water max. 6 °C |
Best Time to Visit the Regions
Find the best time to visit the regions (Northern America Cruises) in the following overview.| Location | Best Time to Travel |
|---|---|
| Montreal | May, June, July, August, and September |
| New York | May, June, July, August, and September |
| Boston | May, June, July, August, and September |
Climate Charts Northern America Cruises
In the following, you will find climate charts for the regions.
Furthermore, there are some charts you can use for quick comparison of climate between the regions.
Show Climate Chart for
Montreal

Show temperatures in degree


Source of Data: German Weather Service (Offenbach) and Wikipedia
Climate Tables Northern America Cruises
In the following, you will find some climate tables for Northern America Cruises, containing information about Temperatures, Precipitation, Water Temperatures, and Hours of Sunshine.Show climate table for
Temperatures, Precipitation, Sunshine in Montreal (Northern America Cruises)
| Jan | Feb | Mar | Apr | May | Jun | Jul | Aug | Sep | Oct | Nov | Dec | |
|---|---|---|---|---|---|---|---|---|---|---|---|---|
| Day Temperature | -6° | -4° | 2° | 11° | 19° | 24° | 26° | 25° | 19° | 13° | 5° | -2° |
| Night Temperature | -15° | -13° | -7° | 1° | 8° | 13° | 16° | 14° | 9° | 3° | -2° | -10° |
| Precipitation (inch) | 3.08 | 2.42 | 2.9 | 3.07 | 3 | 3.27 | 3.59 | 3.65 | 3.65 | 3.06 | 3.65 | 3.2 |
| Rainy days | 17 | 13 | 14 | 13 | 13 | 13 | 12 | 12 | 12 | 13 | 15 | 16 |
| Hours of Sunshine | 4 | 5 | 7 | 7 | 10 | 10 | 11 | 10 | 7 | 6 | 4 | 3 |
Show temperatures in degree
Temperatures
The annual average temperature in Montreal is 6.2 °C.For comparison: London 11 °C, NYC 12 °C, LA 17.9 °C
Warmest month: July (20.9 °C)
Coldest month: January (-10.2 °C)
Precipitation
Overall annual precipitation: 38.55 inch on 163 rainy daysFor comparison: London 24.06 in, NYC 41.57 in, LA 12.01 in
There is no rainy season (months with more than 6.9 in of precipitation).
Months that have possible snowfall: January, February, March, April, October, November, and December
Sunshine
As our climate table shows, July is the sunniest month with an average of 11.4 hours of sunshine per day. Over the year, there are 7 hours of sunshine per day on average. For comparison: London has 4.1, NYC has 7 and LA has 8.9 hours of sunshine per day on average.Temperatures, Precipitation, Sunshine in New York (Northern America Cruises)
| Jan | Feb | Mar | Apr | May | Jun | Jul | Aug | Sep | Oct | Nov | Dec | |
|---|---|---|---|---|---|---|---|---|---|---|---|---|
| Day Temperature | 3° | 4° | 9° | 15° | 21° | 26° | 29° | 28° | 24° | 18° | 12° | 6° |
| Night Temperature | -4° | -3° | 1° | 7° | 12° | 17° | 21° | 20° | 16° | 10° | 5° | -1° |
| Water Temperature | 3° | 2° | 4° | 8° | 13° | 18° | 22° | 23° | 21° | 17° | 11° | 6° |
| Precipitation (inch) | 3.04 | 2.86 | 3.6 | 3.79 | 3.82 | 3.57 | 4.07 | 3.75 | 3.39 | 3.02 | 3.81 | 3.4 |
| Rainy days | 8 | 8 | 9 | 8 | 9 | 8 | 8 | 8 | 7 | 6 | 8 | 9 |
| Hours of Sunshine | 5 | 5 | 7 | 7 | 8 | 9 | 8 | 9 | 8 | 7 | 5 | 5 |
Show temperatures in degree
Temperatures
The annual average temperature in New York is 12.4 °C.Warmest month: July (24.7 °C)
Coldest month: January (-0.4 °C)
The maximum water temperature in New York is 23 °C. You can take a bath at these temperatures.
Months with water temperature of at least 17 °C (Limited bathing is possible):
June, July, August, September, and October
Months with water temperature of at least 21 °C (adequate for beach vacation):
July, August, and September
Precipitation
Overall annual precipitation: 42.12 inch on 96 rainy daysThere is no rainy season (months with more than 6.9 in of precipitation).
Months that have possible snowfall: January, February, March, and December
Sunshine
As our climate table shows, June is the sunniest month with an average of 9.2 hours of sunshine per day. Over the year, there are 7 hours of sunshine per day on average.Temperatures, Precipitation, Sunshine in Boston (Northern America Cruises)
| Jan | Feb | Mar | Apr | May | Jun | Jul | Aug | Sep | Oct | Nov | Dec | |
|---|---|---|---|---|---|---|---|---|---|---|---|---|
| Day Temperature | 2° | 3° | 8° | 13° | 19° | 25° | 28° | 27° | 23° | 17° | 11° | 5° |
| Night Temperature | -6° | -5° | -0° | 5° | 10° | 15° | 18° | 18° | 14° | 8° | 4° | -3° |
| Water Temperature | 2° | 1° | 3° | 7° | 12° | 16° | 18° | 19° | 17° | 13° | 9° | 4° |
| Precipitation (inch) | 3.59 | 3.62 | 3.69 | 3.6 | 3.25 | 3.09 | 2.84 | 3.24 | 3.06 | 3.3 | 4.22 | 4.01 |
| Rainy days | 9 | 8 | 9 | 9 | 9 | 8 | 7 | 8 | 7 | 7 | 9 | 10 |
| Hours of Sunshine | 5 | 6 | 7 | 8 | 9 | 10 | 10 | 9 | 8 | 7 | 5 | 5 |
Show temperatures in degree
Temperatures
The annual average temperature in Boston is 10.7 °C.Warmest month: July (23.1 °C)
Coldest month: January (-1.9 °C)
The maximum water temperature in Boston is 19 °C. Comfortable bathing is possible at water temperatures of about 21 °C.
Months with water temperature of at least 17 °C (Limited bathing is possible):
July, August, and September
Precipitation
Overall annual precipitation: 41.51 inch on 100 rainy daysThere is no rainy season (months with more than 6.9 in of precipitation).
Months that have possible snowfall: January, February, March, April, November, and December
Sunshine
As our climate table shows, July is the sunniest month with an average of 9.7 hours of sunshine per day. Over the year, there are 7.2 hours of sunshine per day on average.Popular Activities
NYC: 9/11 Memorial & Museum Timed-Entry Ticket
Culture & history
from 17 $ »
Reflect on the events of September 11, 2001 when visiting the poignant 9/11 Memorial & Museum. Listen to personal stories of remembrance & resilience following the terrorist attacks.
New York One World Observatory: Skip-the-Line Ticket Options
Culture & history
from 47 $ »
Journey to the top of the tallest building in the Western Hemisphere and admire the incredible views over New York. Pre-book tickets and choose between 3 ticket options.
New York City: Statue of Liberty & Ellis Island with Ferry
Culture & history
from 30 $ »
Explore the Statue of Liberty, Ellis Island, and their museums at your own pace with self-guided audio guides. Soak up the views of the iconic skyline with a round-trip ferry service from New Jersey.
More attractions
NYC: Empire State Building Tickets & Skip-the-Line | NYC: SUMMIT One Vanderbilt Experience Ticket | NYC: Top of the Rock Observation Deck Ticket | NYC: Museum of Modern Art (MoMA) Timed-Entry Ticket | NYC: 1-Hour Cruise Around Statue of Liberty & Ellis Island | New York City: Manhattan Island Helicopter Tour | NYC: Edge Observation Deck Admission Ticket |Current Weather and Forecast
Current Weather in Montreal
Clouds: 75 % Wind: 7 mph NO
Air Pressure: 1023 hPa Humidity: 72 %
Air Pressure: 1023 hPa Humidity: 72 %
Last updated: 7th Feb 2023, 04:44 pm
The next days …
| 8th Feb 2023 | 9th Feb 2023 | 10th Feb 2023 | 11th Feb 2023 | 12th Feb 2023 | 13th Feb 2023 |
|---|---|---|---|---|---|
| -9 °C to 2 °C | -10 °C to 2 °C | -4 °C to 2 °C | -13 °C to -4 °C | -16 °C to -4 °C | -12 °C to 1 °C |
| Clouds: 82 % | Clouds: 100 % | Clouds: 100 % | Clouds: 33 % | Clouds: 19 % | Clouds: 58 % |
| 0.01 in of rain | 0.13 in of rain | 0.22 in of rain | 0.03 in of snow | No Precipitation | 0.01 in of snow |
Weather information provided by OpenWeatherMap. (CC BY-SA)
Show temperatures in degree
Cruises: Regions
Northern America Cruises is part of the holiday destination Cruises. We analyzed the climate for additional regions, in order to provide you with information about the best time to visit and the expected holiday weather:Cruises | Mediterranean Cruises | Caribbean Cruises | Canary Islands Cruises | Middle East Cruises | Northern Europe Cruises | Asia Cruises | Baltic Sea Cruises | Alaska Cruises | South America Cruises | South Pacific Cruises | Nile River Cruises | Danube River Cruises | Rhine River Cruises | Hawaii Cruises |
![Queen Mary 2 New York (Roderick Eime) [flickr.com] CC BY
License Information available under 'Proof of Image Sources'](/wp-content/uploads/reiseziele/queen-mary-2-new-york43042.jpg)
Hottest Month
 July: 29 °C
Day Temperature in New York
July: 29 °CDay Temperature in New York
Coldest Month
 January: -15 °C
Night Temperature in Montreal
January: -15 °CNight Temperature in Montreal
Rainiest Month
November: 4.22 in
Rain in Boston
November: 4.22 inRain in Boston
Driest Month
 February: 2.42 in
Rain in Montreal
February: 2.42 inRain in Montreal
Maximum Water Temperature
August: 23 °C
Water Temperature in New York
August: 23 °CWater Temperature in New York
Sunniest Month
 July: 11.4 hours/day
Sunshine in Montreal
July: 11.4 hours/daySunshine in Montreal
Activities and Attractions
New York: Go City Explorer Pass with 95+ Tours & Attractions
Culture & history
from 74 $ »
New York City: American Museum of Natural History Ticket
Culture & history
from 28 $ »
Boston: Whale Watching Catamaran Cruise
Tours
from 68 $ »
Distances to Northern America Cruises
| London | New York | Los Angeles | |
|---|---|---|---|
| Montreal | 3250 mi | 330 mi | 2470 mi |
| New York | 3470 mi | 0 mi | 2450 mi |
| Boston | 3270 mi | 190 mi | 2600 mi |
Show Montreal on Map
Show New York on Map
Show Boston on Map
Continent: North America
All Holiday Destinations in North AmericaShare your Experience and Win
We want to know: how was the weather during your Northern America Cruises holiday? You can win a travel coupon of 1000 $. The price will be raffled among all submissions.

![Crystal Symphony on 47th Street (joiseyshowaa) [flickr.com] CC BY-SA
License Information available under 'Proof of Image Sources'](/wp-content/uploads/reiseziele/crystal-symphony-on-47th-street32615.jpg)
![CEL_SL_Solarium_061 (Roderick Eime) [flickr.com] CC BY
License Information available under 'Proof of Image Sources'](/wp-content/uploads/reiseziele/celslsolarium06168520.jpg)
![P1020971 (Robert Stern) [flickr.com] CC BY-SA
License Information available under 'Proof of Image Sources'](/wp-content/uploads/reiseziele/p102097120792.jpg)